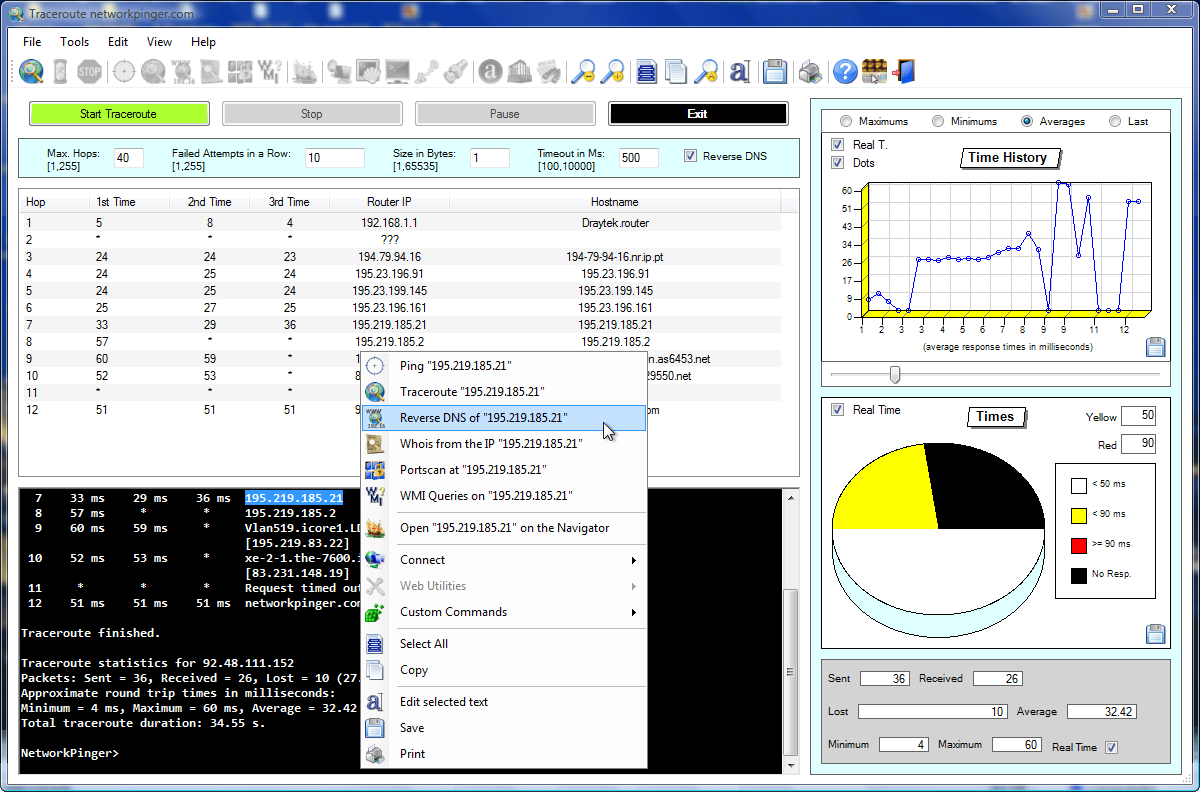
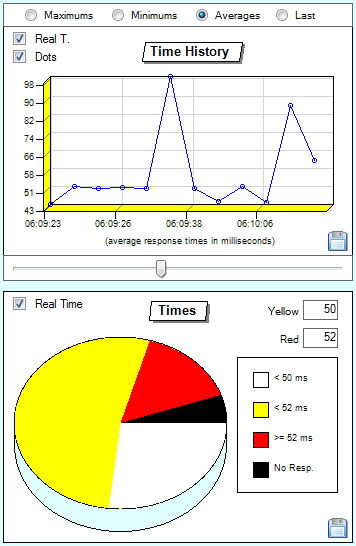
Pie Chart - This chart shows us, through percentage values, the distribution of the results of the pings made by the traceroute command to the hosts through the levels of alert defined by the user, and shows us a pie chart with four colours, each one for a specific response time interval defined for the red and yellow alerts, being the black colour always associated to the pings without any response and the white colour for those pings which are below the limit defined by the user for the yellow alert limit, the yellow colour for those response times between the values of the yellow and red alerts, and the red colour for all those pings equal of superior to the value defined by the user for the red alerts.
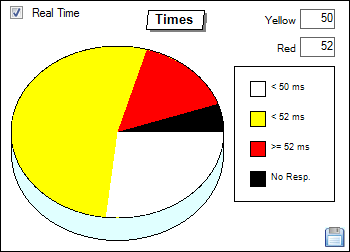
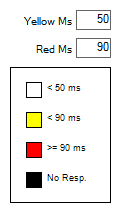 The thresholds of the yellow and red alerts are defined by the user in two boxes created for that, which are embedded on the pie chart itself, and the user only has to define those two values, the yellow alert value and the red one, and the values will automatically be written on the chart in which each colour shall have its associated value, also being the chart updated automatically whenever those values are changed. The values are defined in milliseconds, and it's impossible to define a red alert value below the yellow one, and those two levels of time measured in milliseconds are the ones that will tell the software how the colour distribution on the chart will be done.
This graphical visualization is made according to all the response times for the pings made by the traceroute to the hosts, and it is useful when we want an easy and quick visualization of the levels of response times of those pings made. We can this way see very quickly the levels of response times of a certain traceroute through colours.
Other pie chart functionalities:
There is only one other functionality on the pie chart in the traceroute tool:
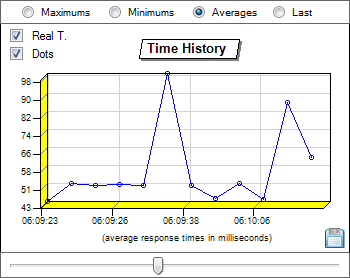
 Real Time - This checkbox, if checked, makes the line chart update itself in real time while new results appear in the table. If this option is turned off, the chart won't update while the traceroute is running, and will only be updated when we click on pause or stop the traceroute, or even when we go back to put the check on the checkbox. It's useful in certain cases when we need maximum performances, which will make us want to deactivate the real time drawing of the chart and this way spending less CPU and accelerating the traceroute, although the charts don't occupy much resources on the computer due to being very optimized.
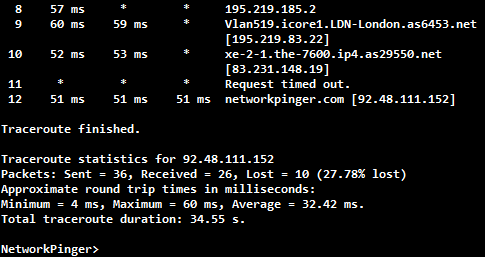
Statistics Panel
Right below the Command Panel we have this panel, with six statistics and one option, which will be updated in real time if the real time checkbox is checked. These statistics and options are related to the pings made by the traceroute command. These are:
- Sent - This box gives us the total number of pings made to the host.
- Received - This box gives us the total number of pings made to the host that got an answer.
- Lost - This box gives us the total number of pings made to the host that didn't get an answer.
- Average - This box has the average response time of all the pings made to the host, measured in milliseconds.
- Minimum - This box has the minimum response time of all the pings made to the host, measured in milliseconds.
- Maximum - This box has the maximum response time of all the pings made to the host, measured in milliseconds.
- Real Time - This is an option that simply turns on of off the real time updating of statistics during the command execution. If it doesn't have that check on its checkbox, the statistics, whether the traceroute is running or on pause or even stopped, will only be updated if the user puts the check on this checkbox again, to allow the user to keep the statistics unchanged for comparison reasons whenever necessary, just by removing the check on this checkbox. The statistics will also be updated, if this option is unchecked, when we end or put in pause a traceroute.